Access the Data
Data Literacy Initiative
The Challenge:
The Los Angeles Department of Neighborhood Empowerment (DONE) was overwhelmed with requests from community leaders for data on local problems.
With government policies relying on data analysis, citizens needed data literacy resources to enact change.
The Initiative:
Through research, workshops, and an open-source site, Access the Data empowers communities with data literacy.
Design Mission
Create an intuitive, appealing educational website to help citizens explore how civic data could help them enact change in their community.
Business Aims
● Increase user engagement with open source code/data
● Help the Los Angeles community to learn about open-source data on their own time
● Aid LA citizens’ effective usage of publicly available government data sources, data systems and applications through educational content
My Roles:
-
Developed product vision with design thinking activities, from conducting discovery to high-fi prototyping, to deliver educational content consistent with user needs.
-
Defined research strategy and directed a team of 10 researchers gathering representative user experiences with acquiring, interpreting, and using open-source data.
-
Initiated the user experience efforts, developing wireframes, UI, and branding, and led team growth from two to over ten designers.
Cross-disciplinary team in partnership with the Los Angeles Department of Neighborhood Empowerment
Overview: Origin Story
LA officials were inundated with community leaders requesting data assistance for community problems.
After hosting a series of introductory workshops, EmpowerLA partnered with our Access the Data initiative to create additional content for self-learning.
The project would culminate in a website hosting a wealth of resources and educational modules relevant to immediate citizen concerns, empowering them with the data skillset to enact change.
The Process
The Process
Discovery
I wanted to know where users were hurting the most and how we could provide them solutions.
Drawing upon citizen surveys and stakeholder interviews, my team surfaced key themes for our product to address as summarized in the pain points below.
How might we help users orient a sea of data?
〰️
How might we help users orient a sea of data? 〰️
Who Are Our Users?
Our city stakeholder requested a site welcoming to all citizens searching for help from the city. I delved deeper to identify the why behind the citizens’ search:
What knowledge base did visitors came from, and what knowledge were they were seeking?
We settled upon two personas of users our product would help most: community activists and data amateurs.
Having gathered the gain and pain points of our users, I initiated a presentation of our findings to our Los Angeles government stakeholder, proposing more investigation to get at the heart of users’ needs.
User Research: Lines of Inquiry
When I arrived on the project, it lacked a strategy of primary inquiry. I authored our first research plan, workshopped to consensus with our stakeholders and developers.
User Interview Questions
Upon aligning on objectives, I used our product objectives (at left) to inform the creation of user-side interview questions (right).
Foundational inquiries laid out, it was time to hear from folks firsthand about their relationship with data. My team recruited individuals to interview through our survey and invited them to open up—in some cases for the first time—about their data journey.
The following quotes came from my user interviews.
In Their Own Words: User Interview Highlights
On searching for public government data:
“I had to recreate the analysis on my own to try and infer the same insights they did about something, and that’s the part that’s really painful to me.”
“If public data was easier and more complete, I would be doing a lot more fun analysis at night on my spare time around different issues I am passionate about.”
User Journeys
How Do I Get to Data Literacy? 🤔
Knowing that citizen users came in curious to know ways data might help their community, the next step was crafting a path that could get them oriented from any stage in the journey.
This collective customer journey map evolved out of my interviews with stakeholders, users, and data scientists.
The Website
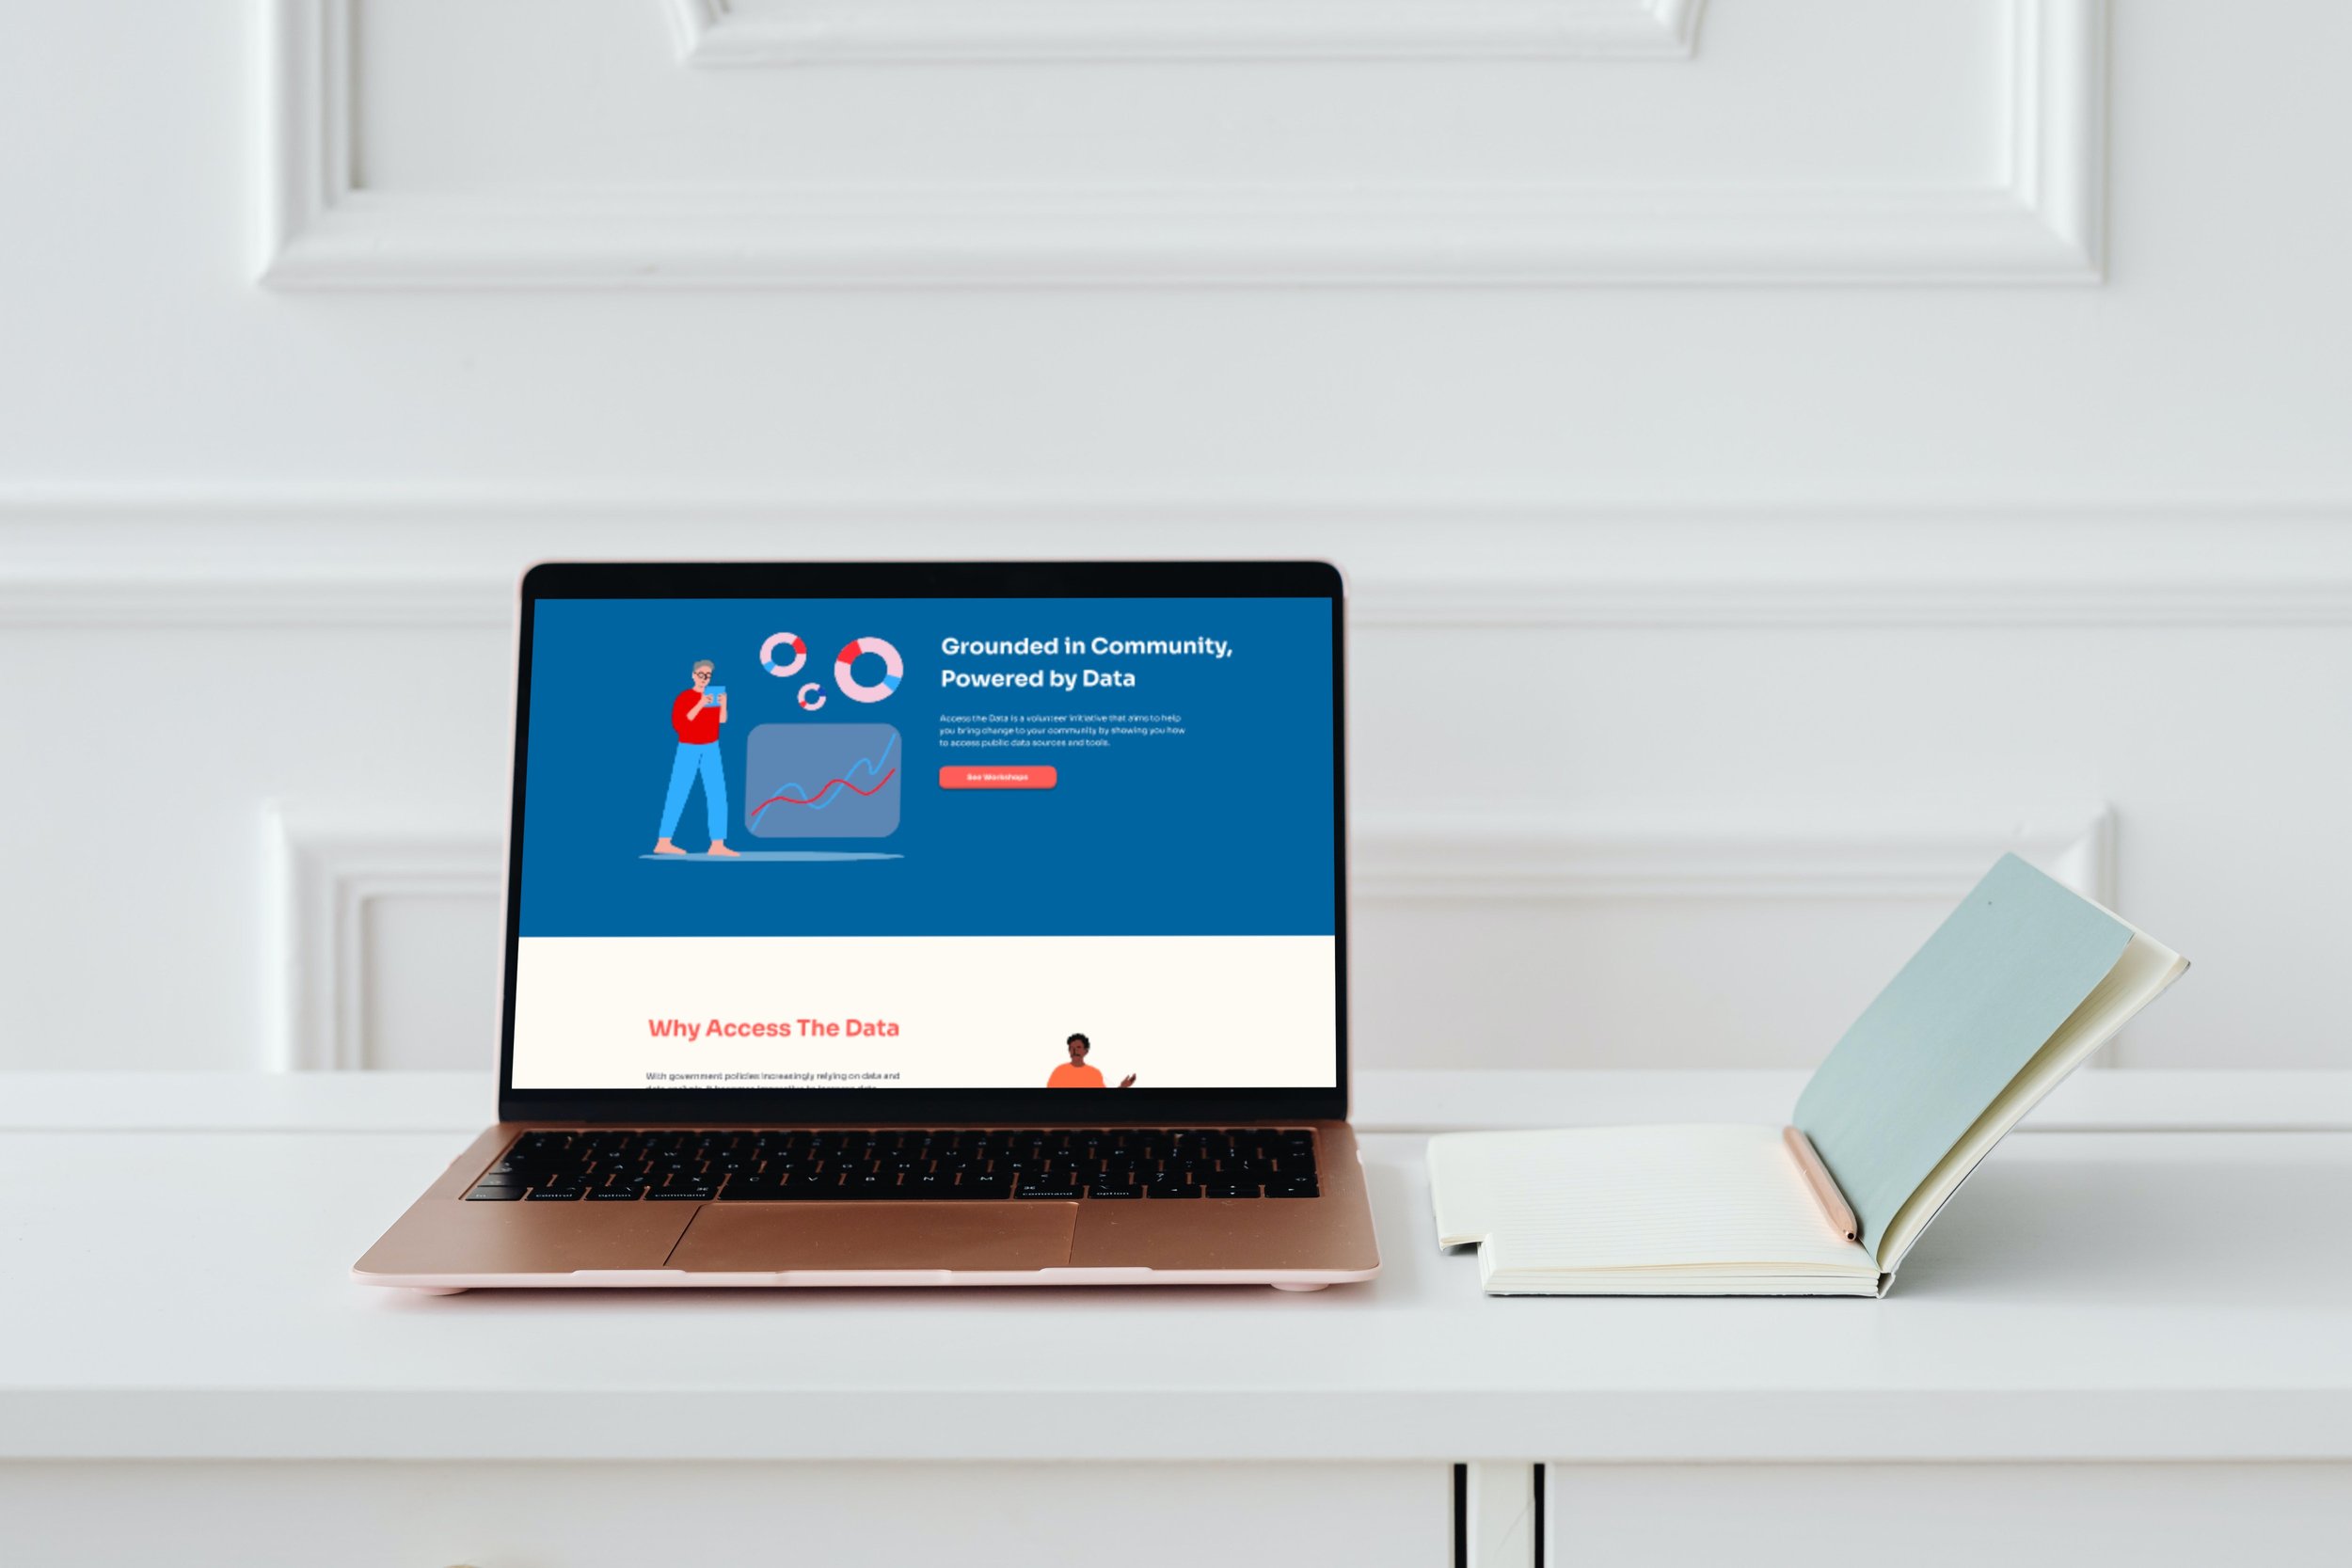
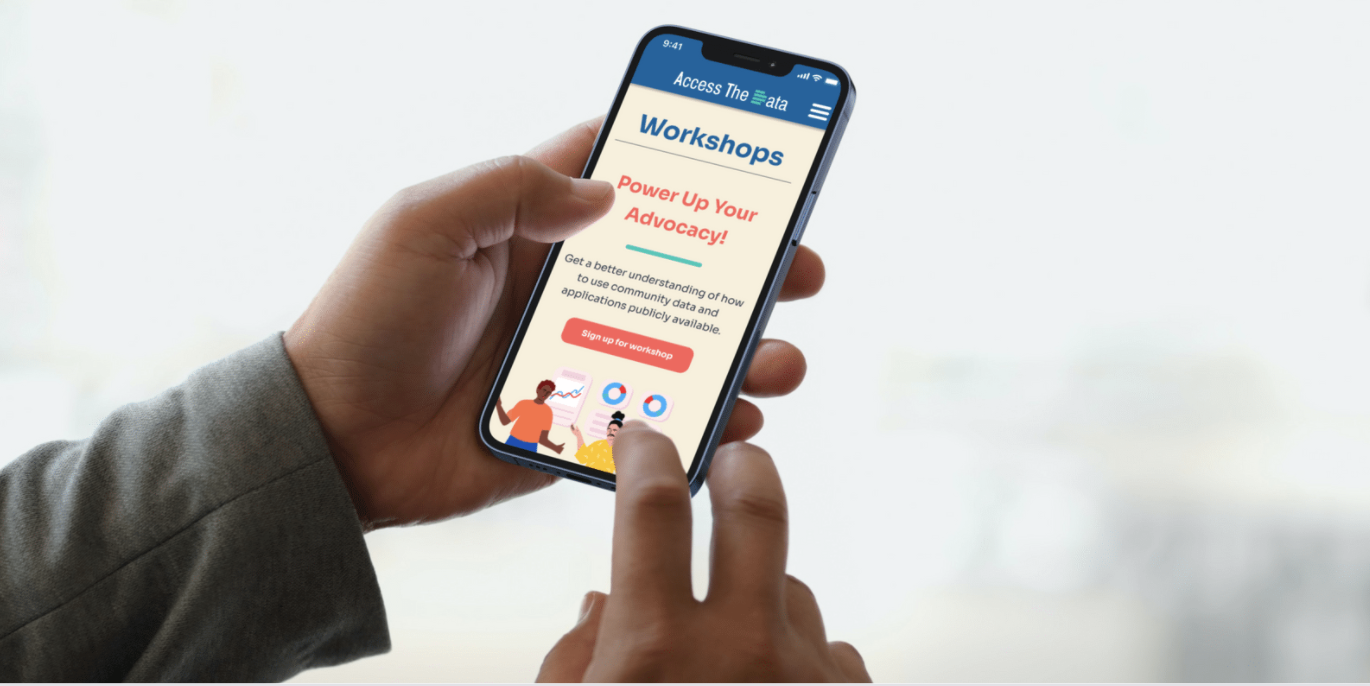
The resulting product, an educational website pending review, is shown below. It incorporates findings from three rounds of usability testing, five field studies, competitive analysis, user interviews, and more.
Grounded in Community, Powered by Data
Over the course of the project, we have progressed from a concept to the development of educational modules and an engaging interface for data seekers of different experience levels.
This product is in development.


